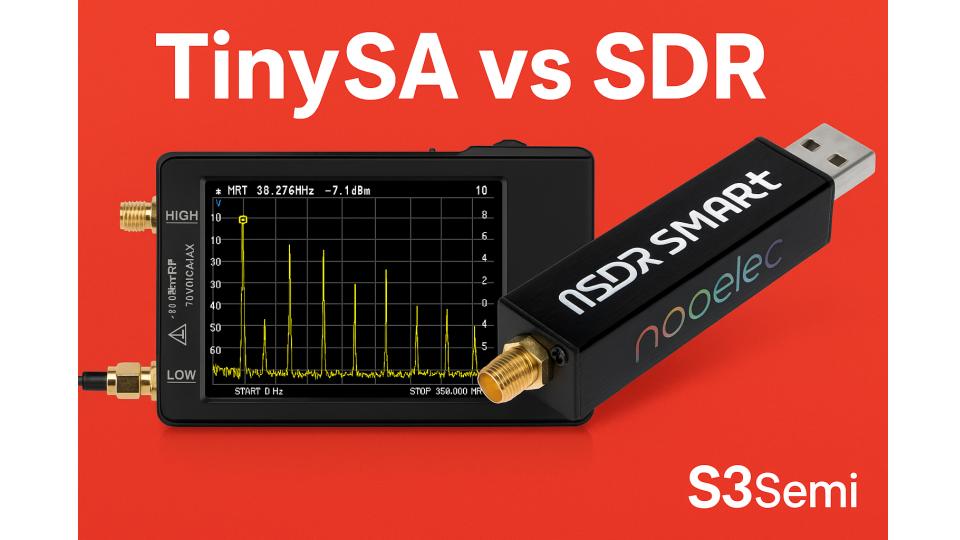
If you’ve been exploring the world of RF measurement or signal analysis, you’ve likely heard of two powerful tools: the TinySA and the Software Defined Radio (SDR). Both are affordable, compact, and incredibly versatile – but they serve very different purposes.
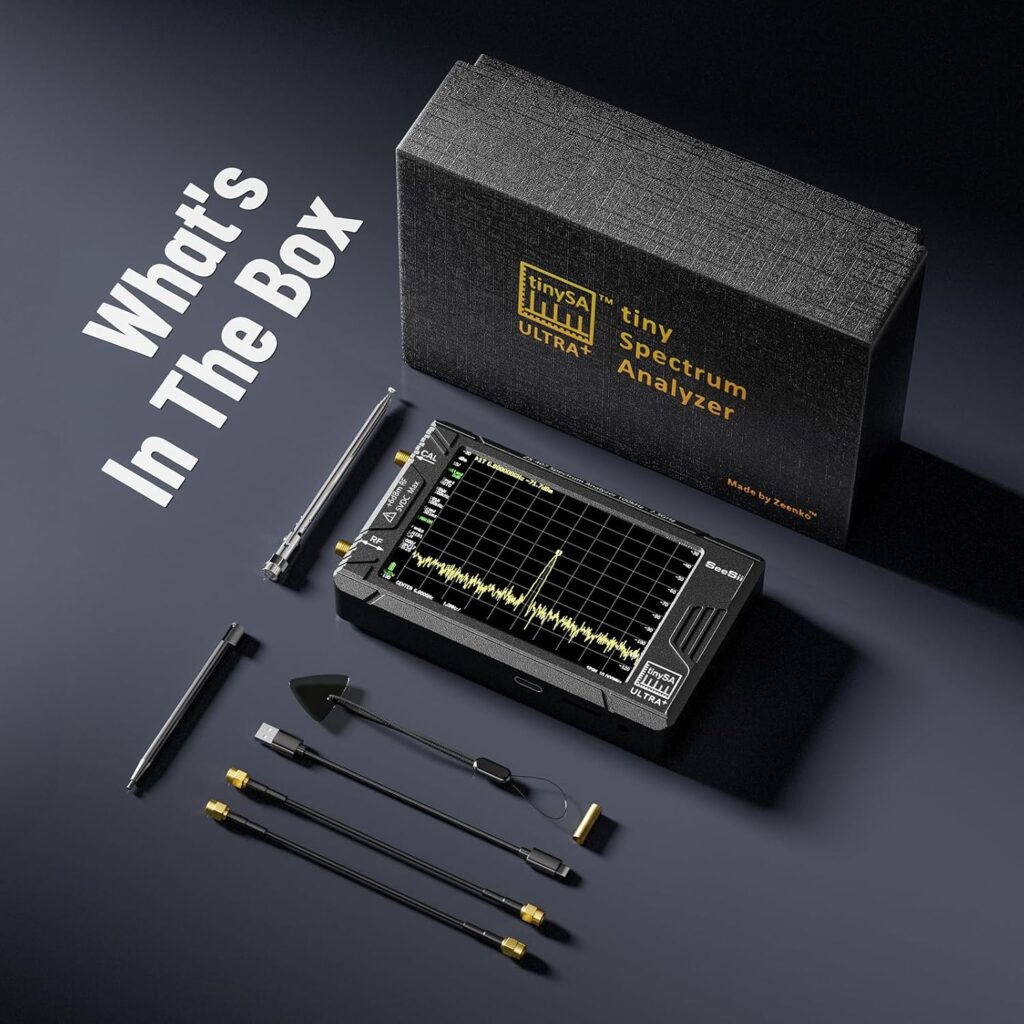
🏷️ TinySA Ultra on Amazon ⭐⭐⭐⭐
Whether you’re a ham radio enthusiast, engineer, or curious hobbyist, understanding the difference between TinySA and SDR will help you choose the right tool for your next project.
⚙️ Overview
At first glance, both devices seem to “analyze radio signals.” But they approach that task from opposite directions.
- TinySA (Tiny Spectrum Analyzer): A spectrum analyzer that shows you the power of signals across a frequency range – essentially, what’s happening in the air.

- Software Defined Radio (SDR): A receiver that captures raw RF data for decoding, demodulation, and listening – it lets you hear, see, and decode the signals.

In simple terms:
👉 TinySA measures signal power.
👉 SDR receives and interprets the signal.
⚡ Key Specification Comparison
| Feature | TinySA (Tiny Spectrum Analyzer) | Software Defined Radio (e.g., RTL-SDR, HackRF, Airspy) |
|---|---|---|
| Primary Function | Measures signal amplitude vs frequency | Receives and decodes RF signals |
| Frequency Range | 100 kHz – 960 MHz (TinySA Basic) Up to 5.3 GHz (TinySA Ultra) | ~24 MHz – 1.7 GHz (RTL-SDR) Up to 6 GHz (HackRF, LimeSDR) |
| Signal Generator | ✅ Yes (tracking generator built-in) | ❌ No (receive-only, unless full-duplex SDR) |
| Measurement Type | Power Spectrum | I/Q signal sampling |
| Dynamic Range | Up to 80 dB (TinySA Ultra) | Typically 50–60 dB |
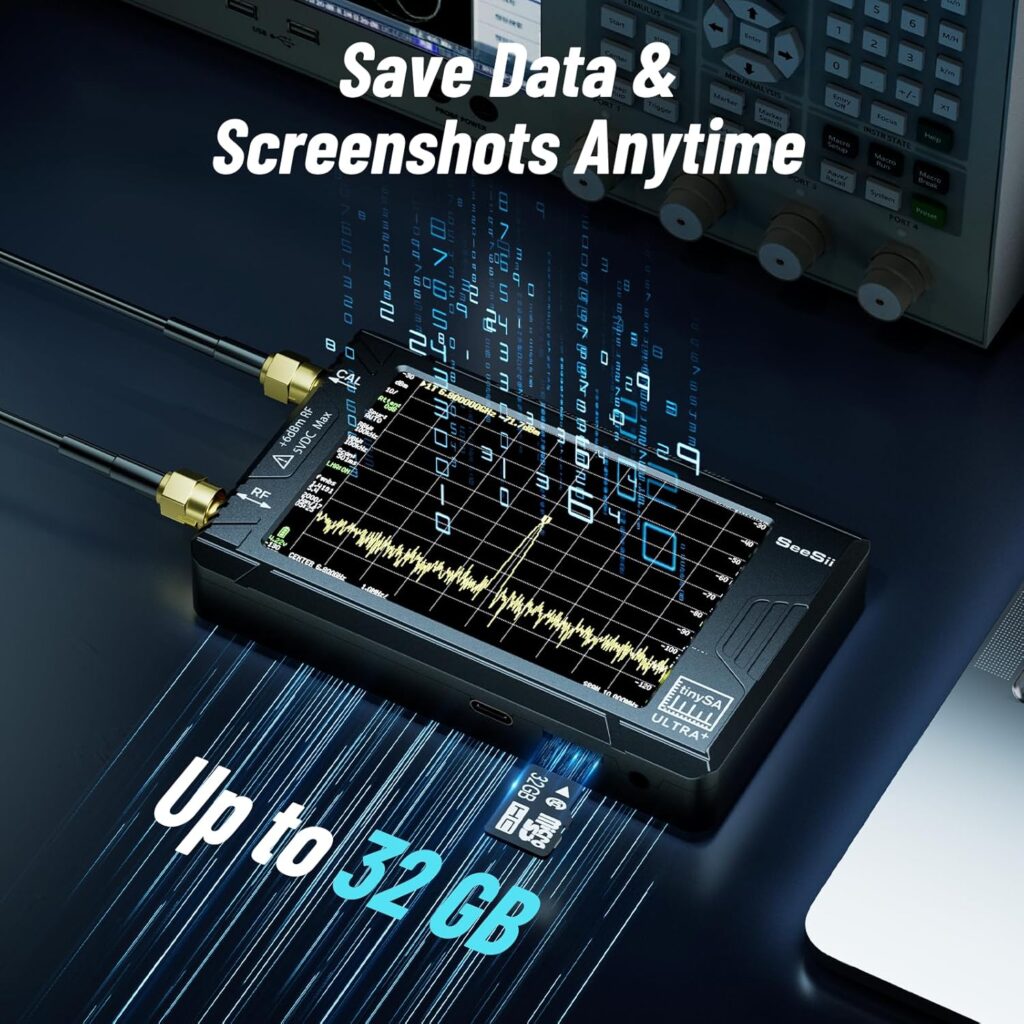
| Display | Built-in touchscreen | Requires PC, phone, or tablet |
| Software | TinySA-App, SigDigger | SDR#, GQRX, SDR++, CubicSDR, GNU Radio |
| Output Data | Frequency vs amplitude plot | Raw I/Q data for decoding |
| Portability | Stand-alone, battery powered | Needs USB connection to host |
| 💳 Price Range (2025) | 💲 Check Price | 💲 Check Price |
| Best For | RF testing, interference hunting, filter measurement | Signal monitoring, decoding, and experimentation |
🧭 How Each Device Works
🔹 TinySA
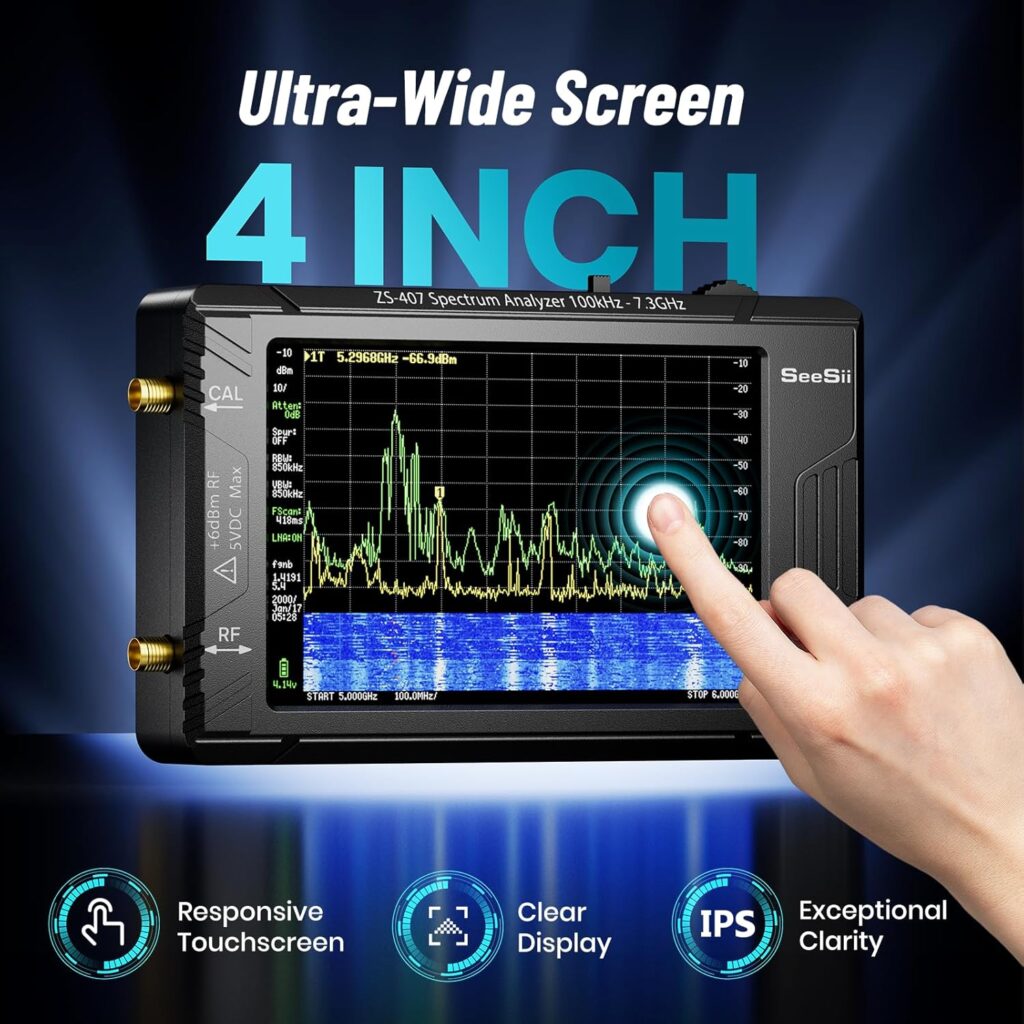
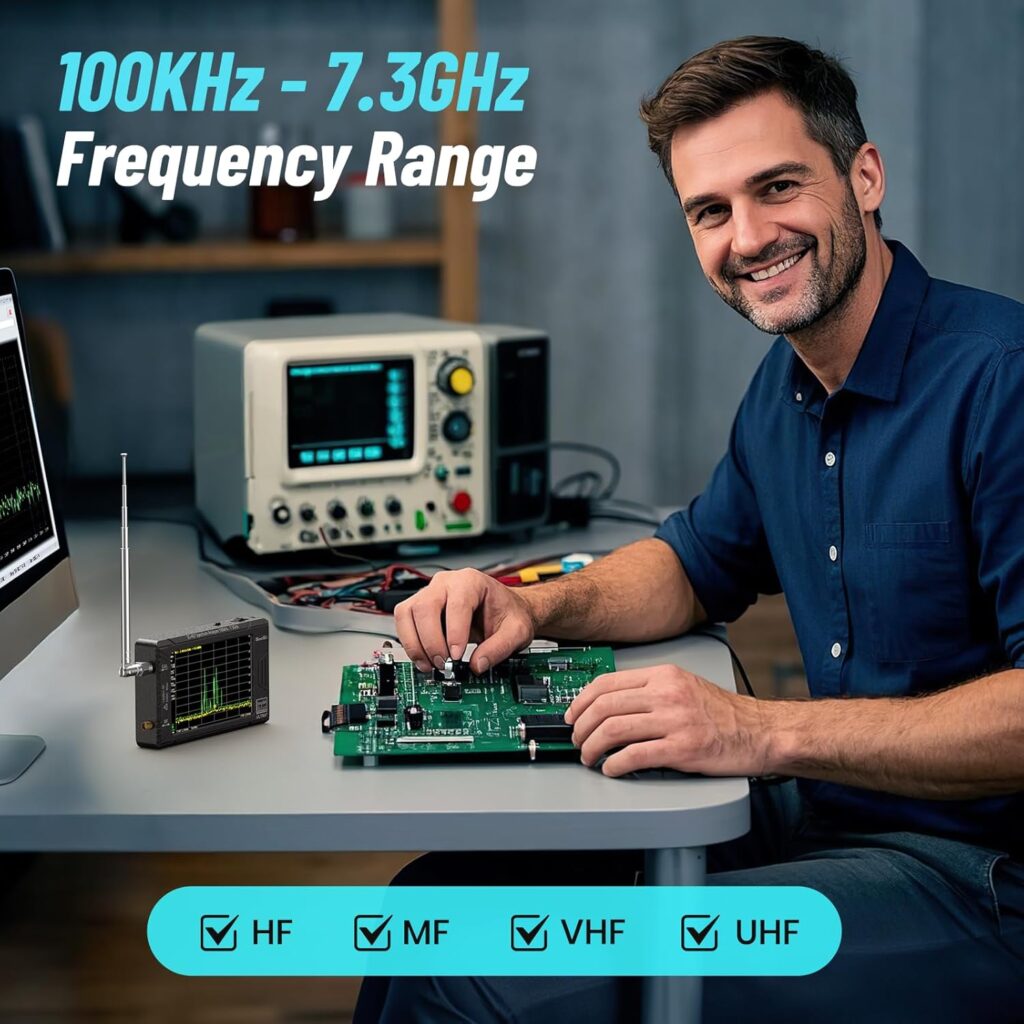
The TinySA works like a traditional spectrum analyzer. It scans a frequency range and displays how much signal power is present at each frequency.
TinySA – 7.3 GHz Portable Spectrum Analyzer on Amazon
It’s ideal for:
- Measuring the frequency and strength of transmitters
- Visualizing harmonic content and spurious emissions
- Testing filters or amplifiers using its tracking generator
Because it’s battery-powered and self-contained, you can take it anywhere – no PC required.
✅ Best for: RF measurements, interference detection, signal verification, and spectrum visualization.
🔹 Software Defined Radio (SDR)
An SDR converts RF signals directly into digital form using high-speed sampling. This lets your computer become the radio – software handles tuning, filtering, and demodulation.
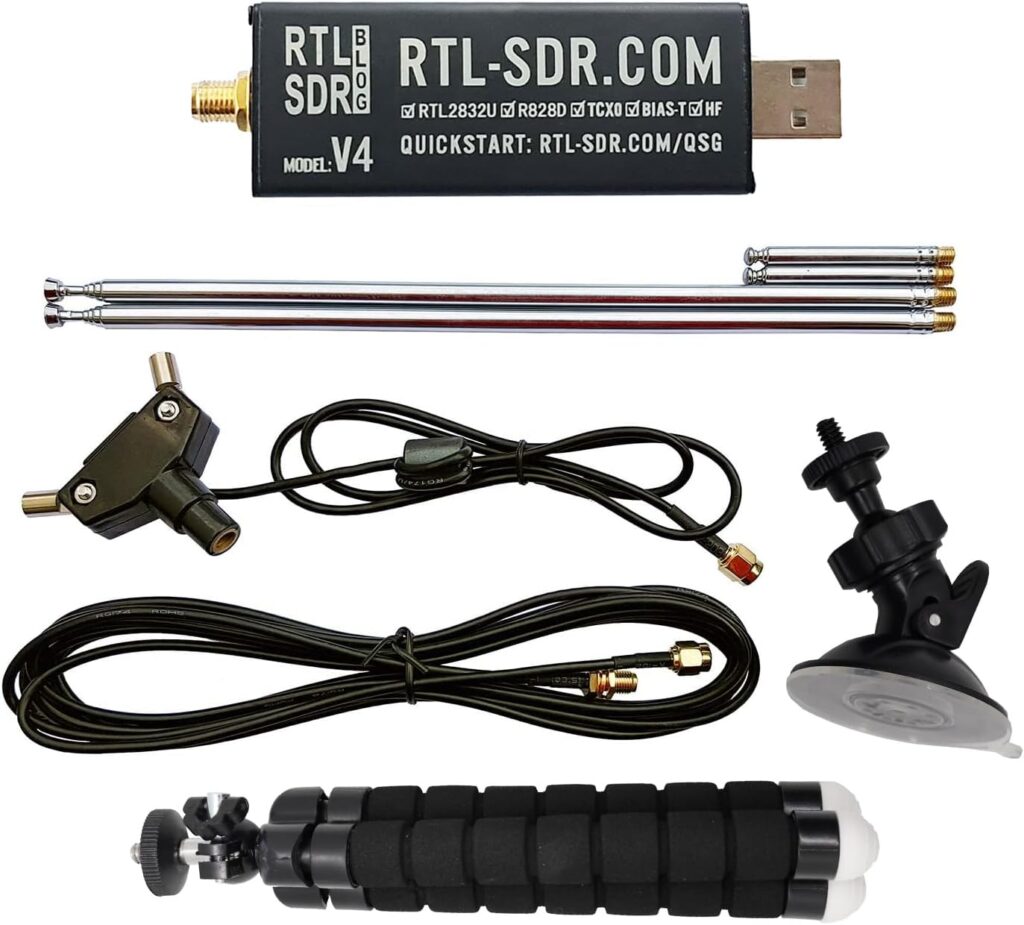
With the right software, you can:
- Listen to FM, AM, and shortwave radio
- Decode digital modes (ADS-B, AIS, APRS, DMR, P25, etc.)
- Analyze weather satellites, GPS, and telemetry
- Record and replay signals for offline analysis
✅ Best for: Signal reception, decoding, learning modulation techniques, and exploring wireless communications.
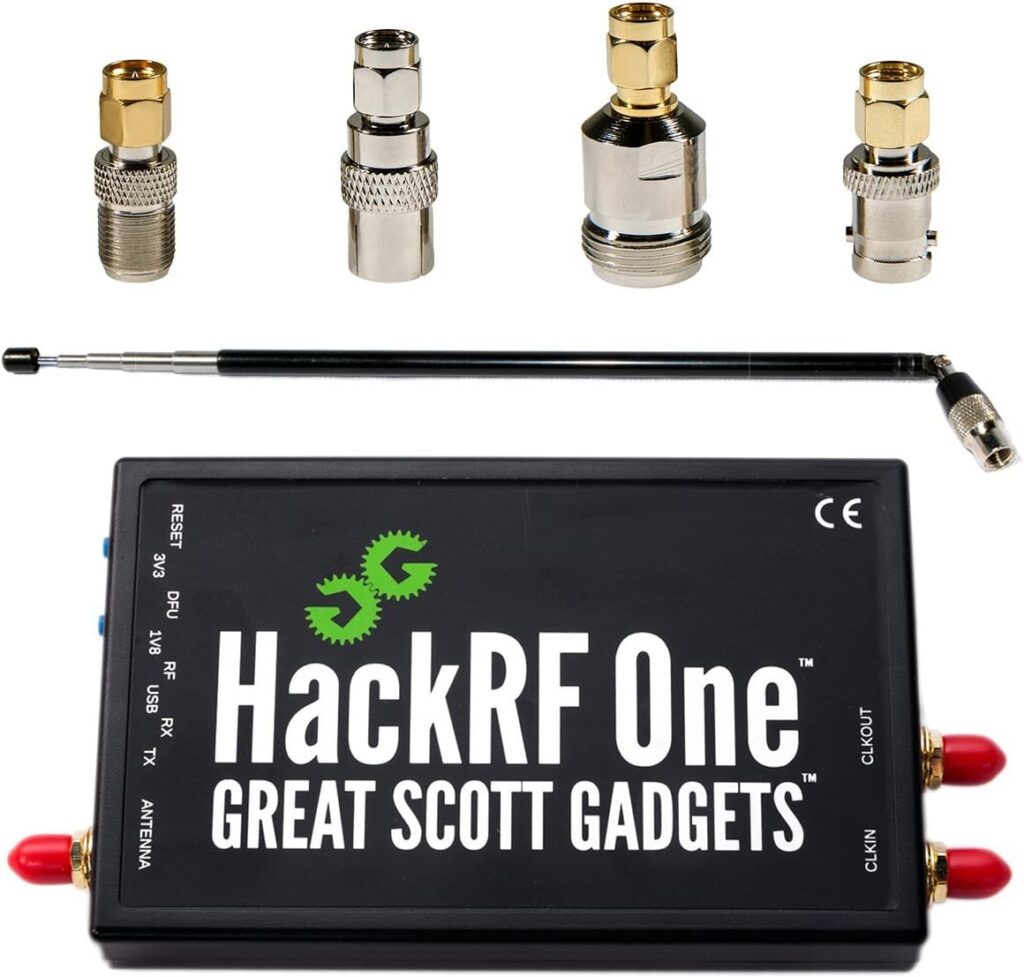
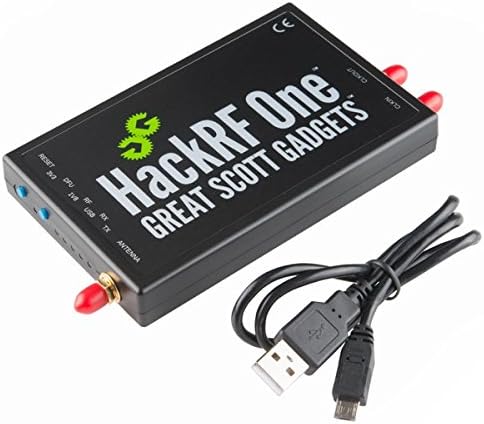
🏷️ HackRF on Amazon ⭐⭐⭐⭐
🧩 Use-Case Comparison
| Use Case | TinySA | SDR |
|---|---|---|
| Checking transmitter frequency and power | ✅ | ⚠️ Approximate only |
| Spectrum analysis and noise detection | ✅ | ✅ (software-based, less precise) |
| Listening to or decoding signals | ❌ | ✅ |
| Testing RF filters, amplifiers, or antennas | ✅ | ⚠️ Limited (requires external tools) |
| Portable field use (battery) | ✅ | ❌ |
| Spectrum recording and analysis | ⚠️ Limited | ✅ |
| Frequency hopping and scanning | ✅ (sweep mode) | ✅ (via software) |
💡 Example Scenario
Let’s say you’re working on a small transmitter and want to ensure it’s clean and compliant.
- With a TinySA, you can see its frequency output, harmonics, and spurious signals instantly.
- With an SDR, you can hear or decode the transmission and check modulation quality or payload data.
So while the TinySA tells you how strong your signal is and where it lies in the spectrum, the SDR tells you what that signal actually contains.
💡 Practical Insights
- TinySA is a measurement instrument, meant to quantify and visualize power across frequency.
- SDR is a receiver, meant to capture and process the content of signals.
- TinySA Ultra can reach microwave frequencies (5.3 GHz), while SDR models like HackRF or LimeSDR can both transmit and receive, enabling full radio experimentation.
🧰 Why You Might Need Both
Many RF enthusiasts use both tools together:
- Use TinySA to inspect the RF environment, test filters, or find interference sources.
- Use SDR to receive and decode the interesting signals you discovered with TinySA.
They complement each other beautifully – one is about measurement, the other about interpretation.
🧭 Final Thoughts
Both the TinySA and Software Defined Radio have revolutionized how we explore the RF spectrum:
- TinySA is a compact, stand-alone analyzer for measuring signal strength and testing hardware.
- SDR is a powerful, computer-based platform for listening, decoding, and experimenting with signals.
If you’re focused on hardware testing, signal purity, or troubleshooting, the TinySA is the perfect fit.
If you’re more interested in receiving, decoding, and experimenting with real-world signals, an SDR is the better choice.
And if you truly love RF exploration – you’ll eventually want both.