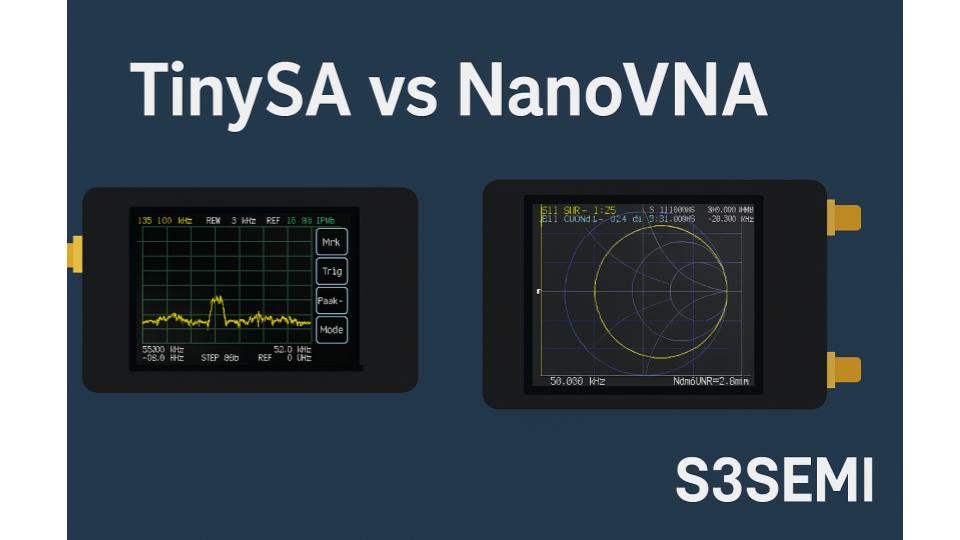
When it comes to affordable RF test tools, two names dominate the conversation – TinySA and NanoVNA. Both are compact, budget-friendly devices that have revolutionized how hobbyists and professionals measure and analyze signals.
🏷️ TinySA Ultra on Amazon ⭐⭐⭐⭐
But while they might look similar, their functions and strengths are quite different.
📡 What They Do
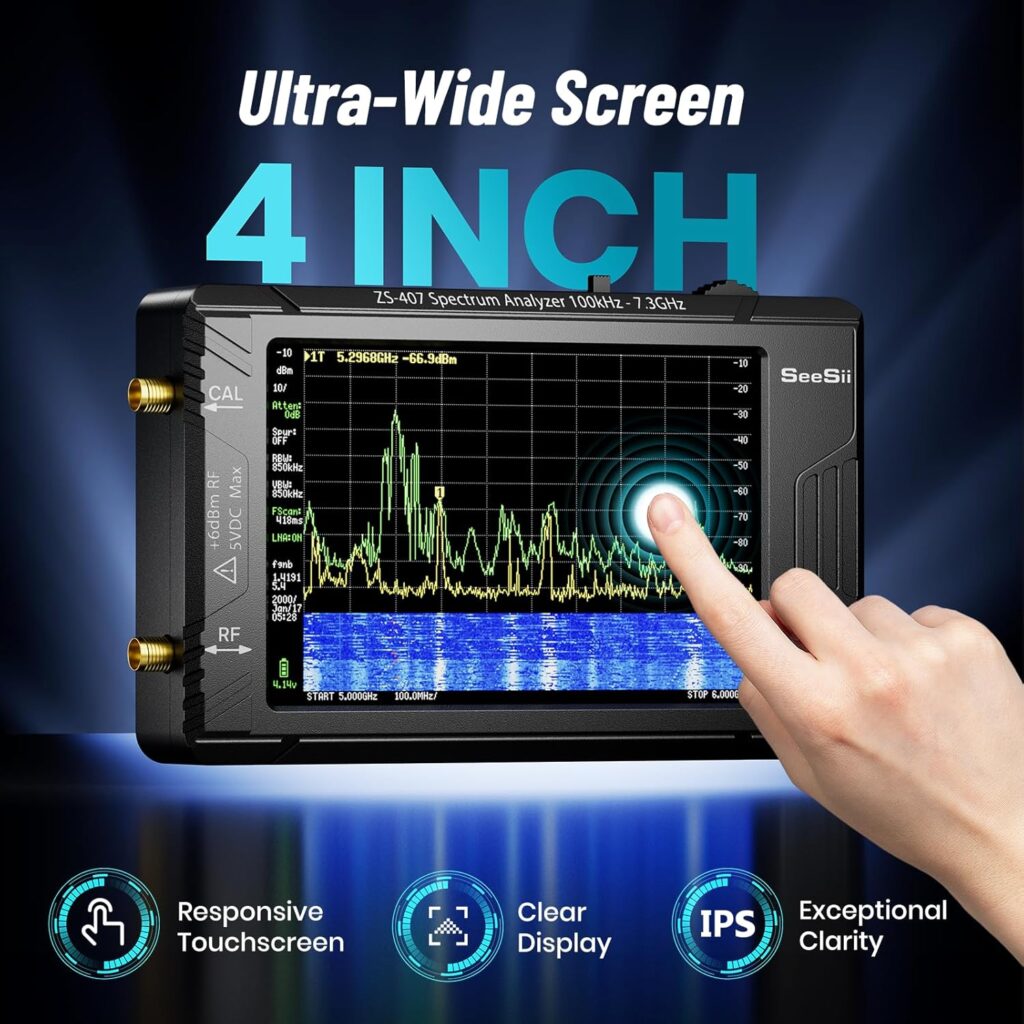
- TinySA (Tiny Spectrum Analyzer) is designed primarily as a spectrum analyzer. It helps you visualize and measure signal strength across frequencies – useful for tracking down interference, checking transmitters, or tuning filters.

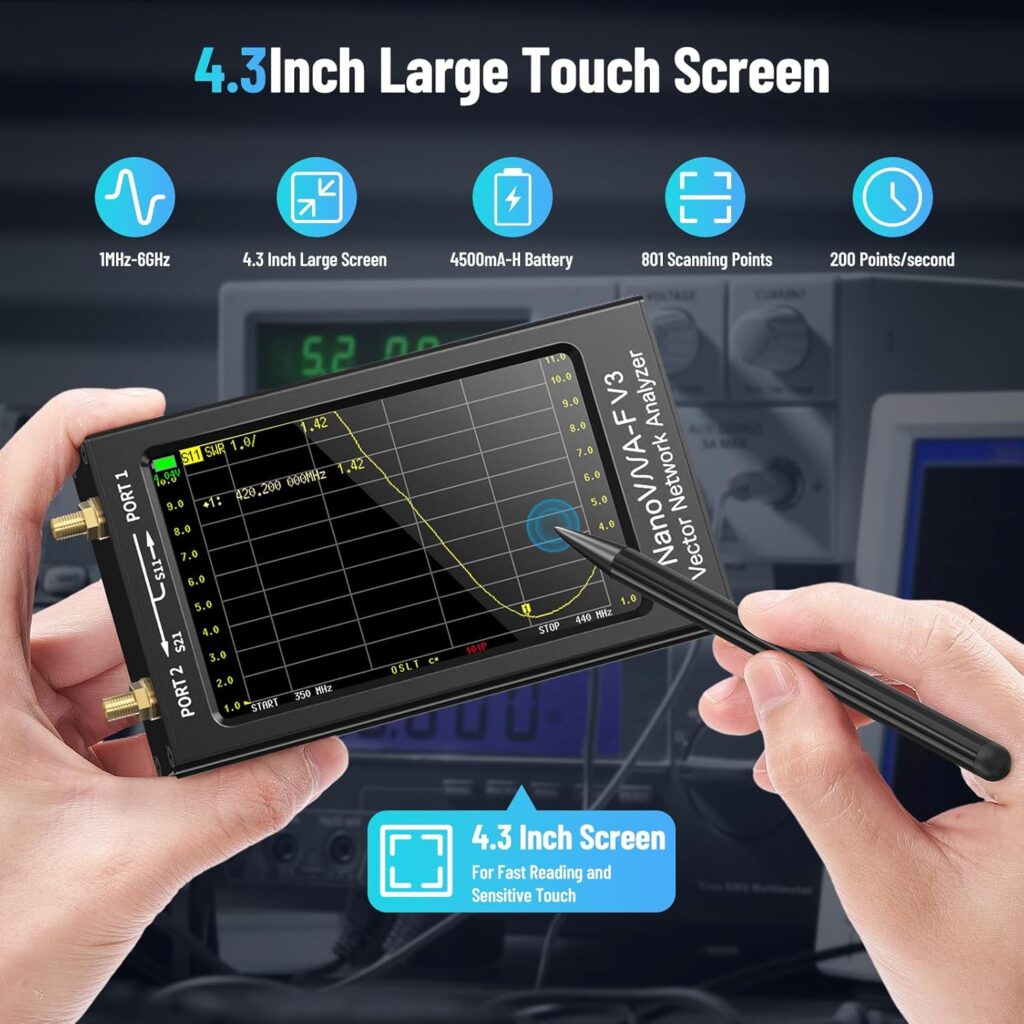
- NanoVNA (Vector Network Analyzer) focuses on S-parameters. It measures how RF circuits respond to signals – perfect for testing antennas, filters, cables, and matching networks.

In short:
👉 TinySA shows what’s on the air.
👉 NanoVNA shows how your circuit behaves.
⚙️ Key Specifications Comparison
| Feature | TinySA | NanoVNA |
|---|---|---|
| Function | Spectrum Analyzer | Vector Network Analyzer |
| Frequency Range | 100 kHz – 960 MHz (TinySA Basic) Up to 7.2 GHz (TinySA Ultra) | 50 kHz – 1.5 GHz (NanoVNA V2 Plus) Some versions up to 6 GHz |
| Dynamic Range | ~ 80 dB (TinySA Ultra) | ~ 70 dB for S11 measurements |
| Measurement Type | Signal power, harmonics, spectrum sweep | S11 (reflection), S21 (transmission), impedance, SWR |
| Display | 4″– 4.3″ color touchscreen | 2.8″ – 4.3″ touchscreen depending on version |
| Calibration | Factory and user calibration options | SOLT (Short-Open-Load-Through) calibration |
| Output Signal Generator | Yes – built-in tracking generator | Yes – for reflection and transmission tests |
| Use Cases | Detecting transmitters, checking filters, harmonic analysis, EMI scanning | Measuring antenna SWR, impedance matching, cable fault analysis |
| Software Support | TinySA-App (Windows/Linux), SigDigger, GQRX (with SDR mode) | NanoVNA-Saver, NanoVNA-App, SDR Angel |
| 💳 Price Range (2025) | 💲 Check Price | 💲 Check Price |
| Power Supply | USB-C (TinySA Ultra) or micro-USB | micro-USB or USB-C |
| Best For | RF debugging and spectrum visualization | RF design and antenna tuning |
🧠 Practical Differences
TinySA
- Ideal for measuring what’s happening in the airwaves – such as signal strength from transmitters or sources of interference.
- The built-in tracking generator lets you test filter passbands or amplifier responses.
- The Ultra version extends coverage up to 7.2 GHz, making it useful for Wi-Fi, cellular, and ISM band work.

NanoVNA
- Excellent for S-parameter testing – checking reflection (S11) and transmission (S21).
- Essential for antenna and filter tuning, impedance measurement, and verifying matching networks.
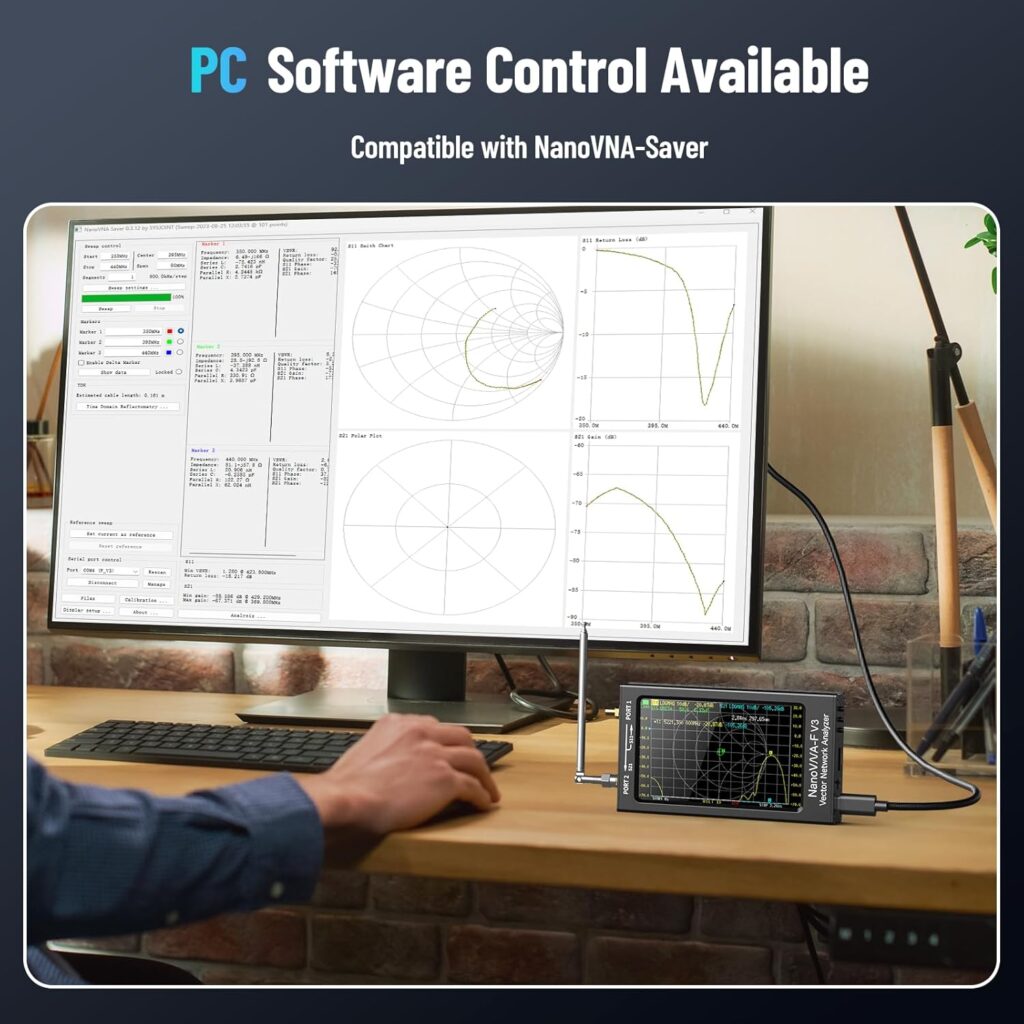
- With NanoVNA-Saver software, you can capture Smith charts, return loss plots, and SWR curves with lab-grade accuracy (within reason).
👉 Check the 6 GHz NanoVNA on Amazon
🧩 Which One Should You Choose?
| If you want to… | Get this |
|---|---|
| Analyze signal strength, detect transmitters, and visualize RF noise | TinySA |
| Tune antennas, test filters, measure impedance or SWR | NanoVNA |
| Do both – on a budget | Both! They complement each other perfectly. |
Many RF engineers and hobbyists use both side-by-side: the TinySA for spectrum scanning and interference detection, and the NanoVNA for fine-tuning components.
🧭 Final Thoughts
Both the TinySA and NanoVNA pack incredible functionality into pocket-sized instruments. The TinySA excels in spectrum analysis and signal visualization, while the NanoVNA shines in circuit characterization and matching work. Together, they form a powerful low-cost toolkit for any RF enthusiast or engineer.
If you’re serious about radio, antennas, or filter design – owning both is easily one of the best investments you can make.